Introduction to Visual Studio C++ Code Coverage
In the ever-evolving field of software development, ensuring that your C++ code is robust, reliable, and thoroughly tested is crucial. One of the most effective ways to achieve this is through code coverage—a metric that helps you understand how much of your code is being executed during testing. In this detailed guide, we will explore Visual Studio C++ Code Coverage, breaking down this powerful tool into simple terms for beginners.
What is Visual Studio C++ Code Coverage?
Visual Studio C++ Code Coverage is a feature in Microsoft’s development environment that helps developers measure the effectiveness of their tests by identifying which parts of their code have been executed. This metric is essential for verifying that all aspects of your application have been tested, thereby reducing the risk of bugs in production.
Why is Code Coverage Important?
- Identifying Untested Code: It highlights the areas of the codebase that haven’t been tested, allowing developers to write additional tests.
- Improving Code Quality: Regularly measuring code coverage can help maintain high standards of code quality.
- Optimizing Tests: It helps in optimizing the test suite, ensuring that tests are comprehensive.
Understanding Native Code Coverage
Native code coverage in Visual Studio is used for unmanaged C++ code, also known as “native code.” Unlike managed code, which runs under the control of the .NET runtime, native code runs directly on the operating system. Visual Studio provides tooling to measure code coverage specifically for these unmanaged C++ applications.

ARM64 Code Coverage
With the rise of ARM64 architecture in modern devices, Visual Studio has extended its code coverage functionality to cater to ARM64. This allows developers to measure how much of their C++ code designed for ARM64 systems is being executed, optimizing performance and ensuring reliability across platforms.
Steps to Enable ARM64 Code Coverage:
- Ensure you have the ARM64 tools installed in Visual Studio.
- Open your project and configure it for ARM64.
- Use the integrated code coverage tools to measure the coverage.

MSVC Compiler Tooling
The Microsoft Visual C++ (MSVC) compiler includes several tools and options that enhance code coverage analysis:
- Instrumentation: Inserts additional code into your C++ application to record coverage data.
- Analysis: Tools to visualize and report the results of code coverage.
Measuring C++ Code Coverage in Visual Studio
Steps to Enable Code Coverage for C++ in Visual Studio:
- Open your Visual Studio and load your C++ project.
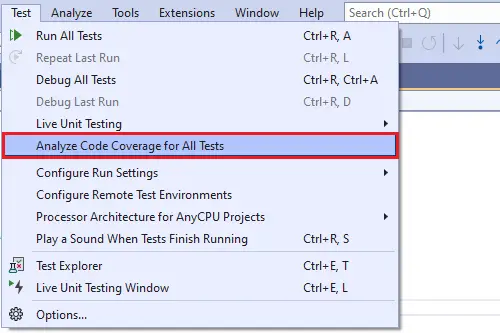
- Navigate to the “Test” menu and select “Analyze Code Coverage.”
- Run your tests, and Visual Studio will automatically collect coverage data.
- Review the results in the Code Coverage Results window.
Microsoft.CodeCoverage.Console
Microsoft.CodeCoverage.Console is a command-line tool for collecting and analyzing code coverage data. It is particularly useful for:
- Automation: Integrating code coverage analysis into build scripts.
- Flexibility: Running code coverage outside the Visual Studio IDE.
Using Microsoft.CodeCoverage.Console:
- Open Command Prompt or Terminal.
- Run the command
CodeCoverage.exe collect -output:.coverage. - Execute your tests.
Code Coverage for Console Apps
For console applications written in C++, Visual Studio provides comprehensive code coverage tools. Here’s how you can use them:
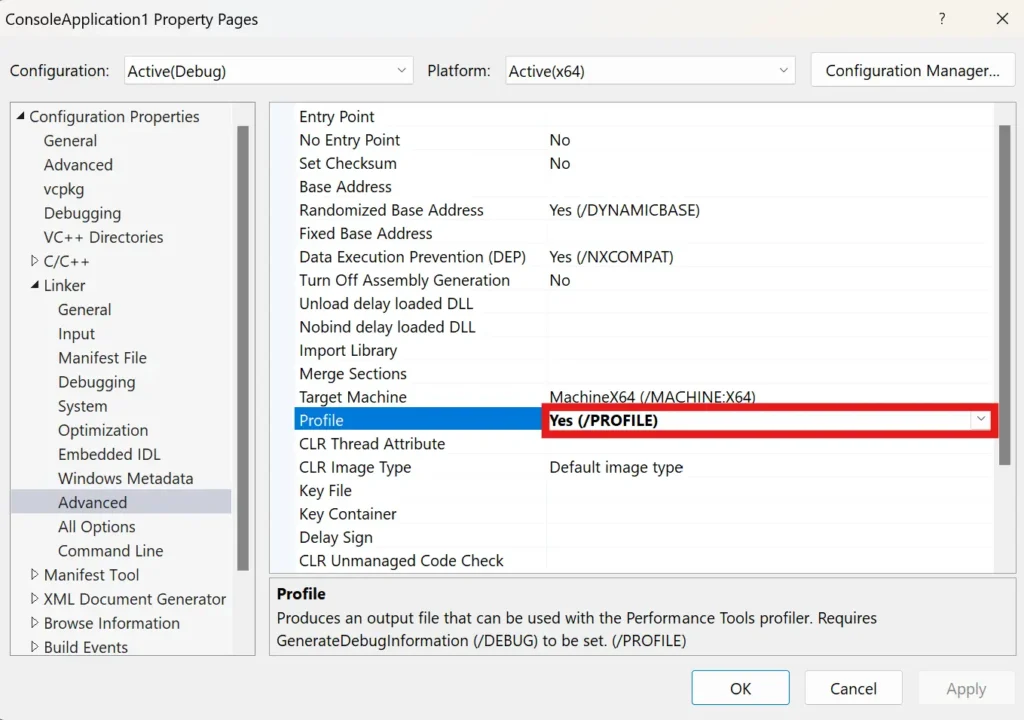
- Configure your console application for code coverage in the project properties.
- Use Visual Studio’s integrated testing tools to run your application.
Code Coverage in CI Pipelines
Continuous Integration (CI) pipelines are integral to modern software development practices. Visual Studio integrates with popular CI/CD tools to provide code coverage metrics as part of the build process.
Setting Up Code Coverage in CI Pipelines:
- Choose a CI tool like Azure DevOps, Jenkins, or GitHub Actions.
- Configure your build pipeline to include steps for collecting code coverage.
- Use the generated reports to monitor code coverage trends over time.
Security Features for Code Coverage in Visual Studio
Visual Studio emphasizes secure code coverage with features like:
- Permissions: Restrict access to code coverage data.
- Encrypted Reports: Ensure code coverage data is securely stored and transmitted.
Key Security Practices:
- Only allow trusted team members to view code coverage reports.
- Regularly audit access to ensure compliance with organizational policies.
Conclusion
Visual Studio C++ Code Coverage is a powerful tool in a developer’s arsenal, enabling thorough testing and high-quality code. By understanding and utilizing native code coverage, ARM64 support, MSVC compiler tooling, console applications, and CI pipelines, developers can ensure their applications are robust and reliable. Implementing the secure practices provided by Visual Studio further guarantees the integrity and confidentiality of the development process.
Frequently Asked Questions (FAQs)
What is code coverage in Visual Studio?
Code coverage in Visual Studio is a measure that shows which lines of your code are executed during testing, helping ensure that your tests are comprehensive.
How do I enable code coverage for C++ in Visual Studio?
You can enable code coverage for C++ by navigating to the “Test” menu, selecting “Analyze Code Coverage,” and running your tests. Visual Studio will handle the rest.
What is Microsoft.CodeCoverage.Console?
Microsoft.CodeCoverage.Console is a command-line tool that allows for collecting and analyzing code coverage data, ideal for automation and flexible testing scenarios.
How can I measure code coverage for ARM64 in Visual Studio?
To measure ARM64 code coverage, you need to install ARM64 tools in Visual Studio, configure your project for ARM64, and use Visual Studio’s coverage tools to collect data.
What are the security features for code coverage in Visual Studio?
Visual Studio offers security features such as restricted access permissions and encrypted reports to ensure the integrity and confidentiality of your code coverage data.
#MSFTAdvocate #AbhishekDhoriya #LearnWithAbhishekDhoriya #DynamixAcademy
References & Read More:
- Introduction to Associated Grid Control in Dynamics 365
- The Ultimate Beginner’s Guide to Microsoft Power Platform: Unleashing Innovation with Low-Code and AI
- A Comprehensive Beginner’s Guide to Visual Studio Pull Requests
- Fix Power Automate Error: There’s a Problem That Needs to Be Fixed to Trigger This Flow Issue
- The Ultimate Beginner’s Guide to VisualStudio.Extensibility 17.11
- Understanding the OptionSet Wrapper Component in Dynamics 365
- Understanding Microsoft Power Platform ROI for Beginners

1 thought on “A Comprehensive Guide to Visual Studio C++ Code Coverage for Beginners”