Introduction to Microsoft Power BI
In today’s fast-paced business environment, the ability to transform raw data into meaningful insights is crucial. Microsoft Power BI emerges as a leading tool in the realm of business analytics, offering a robust platform for data visualization and reporting. This comprehensive tool is designed to help organizations convert vast amounts of complex data into interactive, easy-to-understand visual reports. By doing so, Microsoft Power BI empowers businesses to make informed, data-driven decisions that drive growth and efficiency.
Microsoft Power BI stands out for its user-friendly interface and powerful capabilities. It seamlessly integrates with various data sources, whether they are on-premises or cloud-based, allowing users to aggregate and analyze data from multiple origins. The tool’s dynamic dashboards and real-time data updates ensure that stakeholders have access to the most current information, facilitating timely and strategic decision-making.
Beyond its core functionalities, Power BI offers advanced features such as machine learning integration, natural language processing, and predictive analytics. These features enable users to delve deeper into their data, uncovering trends and patterns that might otherwise go unnoticed. Furthermore, Power BI’s collaborative tools allow for shared insights across teams, fostering a culture of data-driven collaboration within organizations.
As we delve deeper into the various aspects of Microsoft Power BI in this blog post, you will discover how this versatile tool can revolutionize your approach to business analytics. From its intuitive design to its sophisticated analytical capabilities, Microsoft Power BI is poised to be an indispensable asset for any organization looking to harness the power of data.
What is Power BI?
Microsoft Power BI is a powerful business analytics tool designed to transform raw data into meaningful insights through rich visualizations and interactive reports. It consists of several components that work cohesively to facilitate comprehensive data analysis and business intelligence. The primary components include Power BI Desktop, Power BI Service, and Power BI Mobile. These tools collectively enable users to create, share, and access data insights from virtually anywhere.
Power BI Desktop is a dedicated application for creating detailed reports and data models. It provides a robust environment for data manipulation, allowing users to import data from various sources, perform complex transformations, and create interactive visualizations. The Power BI Service, on the other hand, is a cloud-based platform that enables users to share and collaborate on reports and dashboards. It ensures seamless access to data insights across the organization and supports real-time data streaming for up-to-date information.
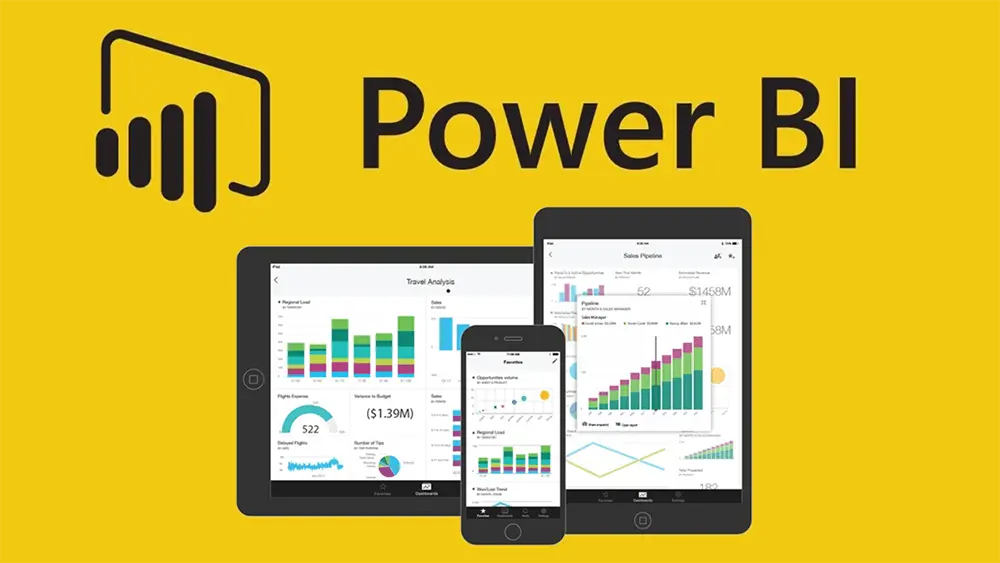
Power BI Mobile extends the accessibility of insights to mobile devices, ensuring that decision-makers can stay informed on the go. This mobile application supports both Android and iOS platforms, offering a responsive interface for interaction with reports and dashboards. Beyond these core components, Power BI integrates seamlessly with other Microsoft products such as Excel and Azure. For instance, users can import Excel data into Power BI for advanced analytics or leverage Azure services for enhanced data processing capabilities.
Power BI’s role in data visualization and business intelligence is pivotal. It empowers users to create visually appealing reports that make data easier to understand and act upon. By enabling deep data insights and fostering a data-driven culture, Power BI aids organizations in making informed decisions. As we look towards enhancements like Power BI 2024, the platform continues to evolve, offering new features and improvements. For those interested, a simple Power BI download can get you started, and accessing your workspace is just a Power BI login away.
Key Features and Advantages of Power BI
Microsoft Power BI offers a suite of features designed to transform raw data into actionable insights. At the core of Power BI are its dashboards and reports, which provide users with a dynamic and interactive way to visualize data. Dashboards are customizable and can aggregate data from multiple sources, offering a comprehensive view of an organization’s key metrics at a glance. Reports, on the other hand, are detailed and can be filtered and drilled down to uncover more in-depth insights.
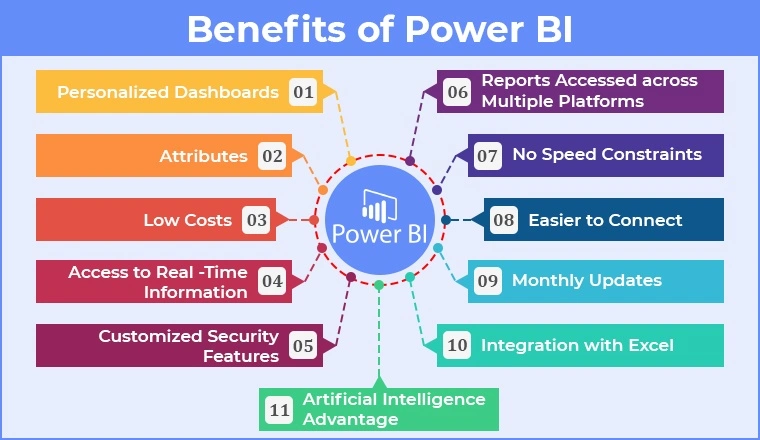
Another significant feature is Power BI’s data modeling capabilities. Data modeling allows users to connect to various data sources, clean and transform data, and create relationships between different data sets. This makes it easier to analyze complex data and derive meaningful patterns. The intuitive drag-and-drop interface simplifies the process, ensuring that even those without a technical background can build robust models.
Data visualization is a standout feature of Microsoft Power BI. The platform provides a wide range of visualization options, from simple bar charts to complex scatter plots and geographic maps. These visualizations are not only aesthetically pleasing but also highly functional, enabling users to quickly identify trends, outliers, and correlations within their data.
The advantages of Power BI extend beyond its feature set. One of the most significant benefits is its user-friendly interface, which makes it accessible to a broad audience, from business analysts to executives. The platform also supports real-time data access, which ensures that decision-makers are always working with the most current information. This is particularly beneficial for organizations that operate in fast-paced environments where timely insights are crucial.
Security is another critical advantage of Power BI. The platform offers robust security features, including data encryption and role-based access controls. These measures ensure that sensitive information is protected and that only authorized personnel can access specific data sets. Additionally, Power BI complies with various industry standards and regulations, providing an added layer of trust for organizations that handle confidential data.
In summary, Microsoft Power BI is a powerful tool that offers a rich set of features designed to enhance data analysis and decision-making. From its user-friendly interface and real-time data access to its robust security features, the advantages of Power BI make it an invaluable asset for organizations looking to harness the power of their data.
Getting Started with Power BI Desktop: Download, Installation, and Login
Getting started with Microsoft Power BI is a straightforward process that begins with downloading the application. To initiate the Power BI download, visit the official Microsoft Power BI website. Here, you’ll find the latest version available for download. Select the appropriate version for your operating system—either Windows or macOS—and follow the prompts to save the installer file to your device.
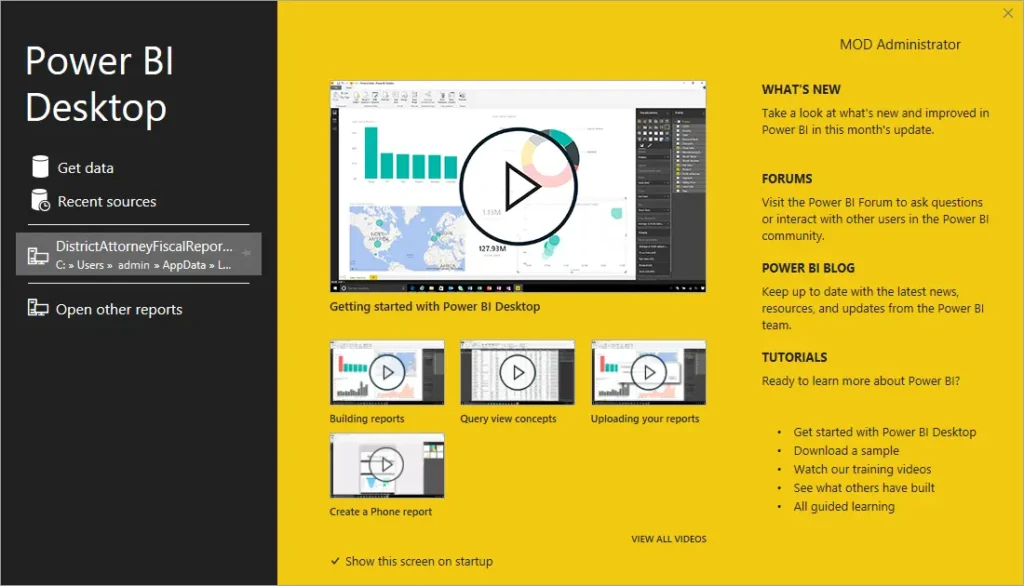
Once the download is complete, locate the installer file and double-click to start the installation process. The setup wizard will guide you through the necessary steps. Typically, this involves agreeing to the terms of service and selecting a destination folder. After you’ve completed these steps, the installation will proceed automatically, and you will be ready to launch Power BI Desktop.
With the application installed, the next step involves the Power BI login. You need a Power BI account to access all features, including data analysis and reporting. If you do not already have an account, you can create one easily. During the login process, you will be prompted to enter your credentials. If you’re new to Power BI, click on the ‘Sign up’ option to create a new account. You must provide basic information such as your email address and create a secure password.
After setting up your account, you can log into Power BI Desktop using your newly created credentials. This grants you access to the full suite of tools and features that Power BI offers. Having a Power BI account is crucial as it allows you to save projects, share reports, and collaborate with team members effectively.
By following these steps—download, installation, and login—you will have Microsoft Power BI up and running in no time, ready to help you unlock actionable insights from your data.
Learning Path: Microsoft Power BI Certification and Courses
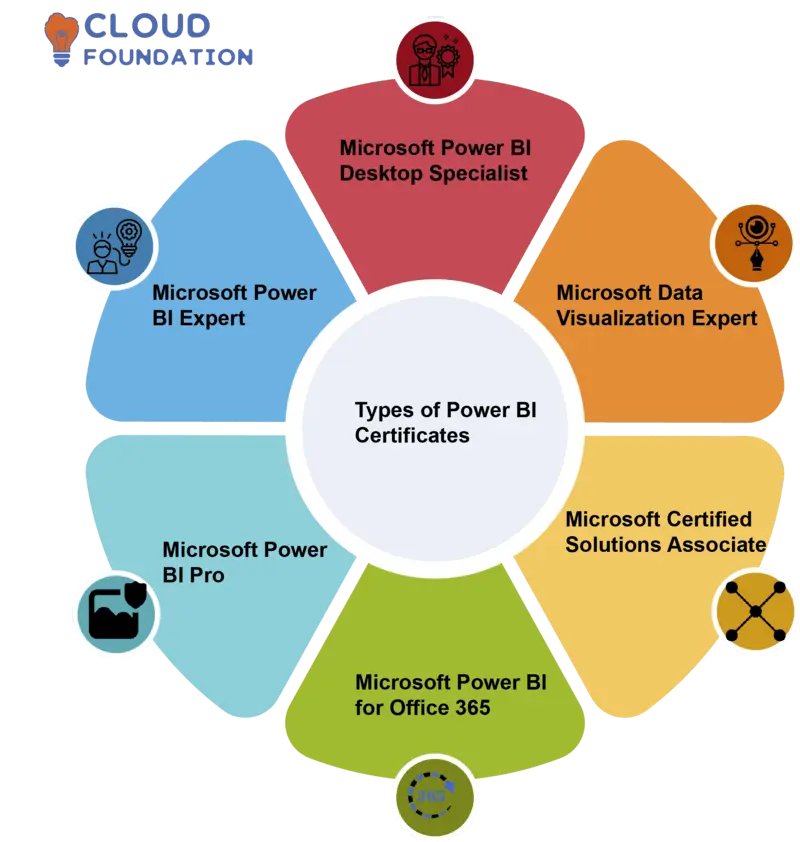
Embarking on a journey to master Microsoft Power BI starts with understanding the various learning resources and paths available, particularly for beginners. One of the most structured and recognized routes is obtaining a Microsoft Power BI certification. This certification not only validates your skills but also enhances your professional credibility in the field of data analytics. The certification process typically involves a series of exams, with the Microsoft Certified: Data Analyst Associate being a popular choice for newcomers.
For those seeking a more flexible learning approach, online courses and tutorials offer a robust foundation. Platforms such as Coursera provide comprehensive Power BI courses that cover everything from basic concepts to advanced data visualization techniques. Coursera’s courses are often curated by industry experts and academic institutions, ensuring that learners receive high-quality education. Similarly, Microsoft Learn offers a plethora of free modules and learning paths specifically tailored to Power BI enthusiasts. These resources are particularly useful for learners who prefer a self-paced, hands-on approach.
Another valuable resource is the Power BI tutorial, which can be found on various educational websites and YouTube channels. These tutorials range from beginner-level introductions to more advanced topics, making them suitable for learners at all stages. They often include step-by-step guides, practical examples, and interactive exercises, enabling learners to apply theoretical knowledge in real-world scenarios.
Additionally, platforms like Udemy and LinkedIn Learning offer specialized Power BI courses that cater to different learning needs and schedules. These platforms often feature courses designed by experienced professionals, covering the latest updates and best practices in Power BI. By leveraging these resources, beginners can build a solid foundation and progressively advance their skills.
In conclusion, whether you opt for a formal certification, an online course, or a detailed tutorial, the key to mastering Microsoft Power BI lies in consistent practice and continuous learning. By exploring these diverse learning paths, you can effectively unlock the full potential of Power BI and enhance your analytical capabilities.
Advanced Techniques: Using DAX and Row-Level Security in Power BI
Microsoft Power BI is a powerful tool for data visualization and analytics, but to unlock its full potential, users must delve into its advanced features, such as Data Analysis Expressions (DAX) and Row-Level Security (RLS). These functionalities not only enhance data analysis but also ensure data security, making Power BI an indispensable asset for any organization.
Data Analysis Expressions (DAX) is a formula language used for creating custom calculations in Power BI Desktop. DAX is essential for performing data manipulation and creating complex measures and calculated columns. For instance, to calculate a running total, you might use the following DAX formula:
RunningTotal = CALCULATE(SUM(Sales[Amount]), FILTER(ALL(Sales), Sales[Date] <= MAX(Sales[Date])))
This formula allows users to aggregate data over a specified time period, providing deeper insights into sales trends. DAX also supports various functions and operators, enabling users to perform sophisticated data transformations and aggregations. By mastering how to use DAX in Power BI Desktop, analysts can derive more meaningful insights from their datasets and make more informed decisions.
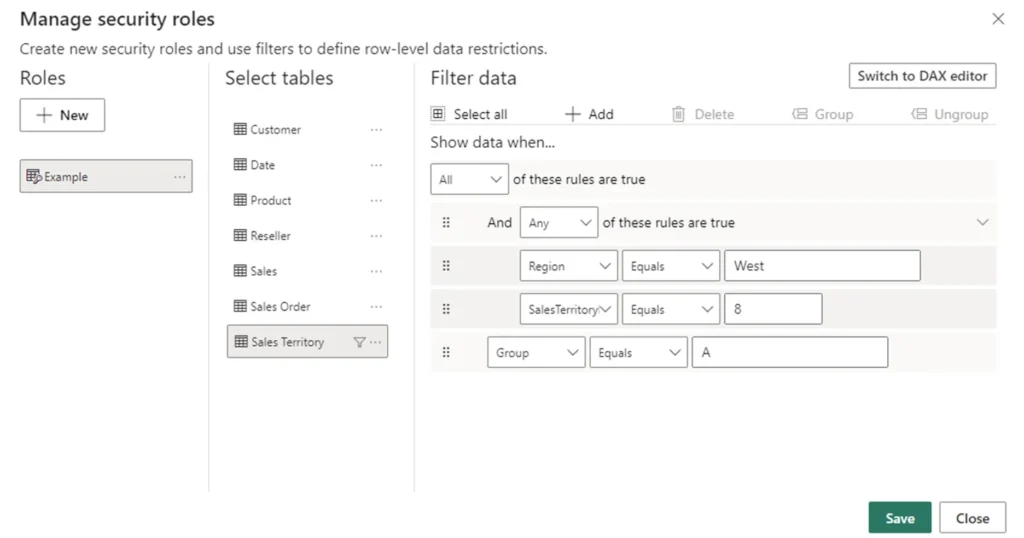
Another critical feature in Power BI is Row-Level Security (RLS). RLS allows administrators to restrict data access for specific users, ensuring that sensitive information is only accessible to authorized personnel. To implement Row-Level Security with Power BI, you first define roles and then create DAX filters to control data visibility. For example, if you want to restrict sales data visibility to regional managers, you can create a role with the following DAX filter:
[Region] = USERNAME()
This filter ensures that users only see data corresponding to their assigned region, thereby maintaining data confidentiality and compliance with organizational policies. Utilizing RLS not only enhances security but also simplifies the management of data access rights within the organization.
Incorporating DAX and RLS into your Power BI practices significantly augments the platform’s capabilities, enabling more precise data analysis and robust security measures. These advanced techniques ensure that Microsoft Power BI remains a comprehensive and secure tool for modern data analytics.
Conclusion: Is Power BI Free ? and Final Thoughts
Throughout this comprehensive guide, we have delved into the multifaceted capabilities of Microsoft Power BI. We explored how this powerful business intelligence tool can transform raw data into insightful visualizations, making it indispensable for data-driven decision-making. We discussed its core components and functionalities, such as data modeling, creating dashboards, and sharing reports, which collectively enhance an organization’s analytical prowess.
A common question that arises is whether Microsoft Power BI is free. The answer is nuanced. Power BI offers a free version, which is quite robust and suitable for individual users who need to create and share personal reports and dashboards. This version includes access to the Power BI Desktop, a powerful tool for creating complex data models and visualizations, as well as limited use of the Power BI Service for publishing and sharing reports.
However, for businesses and professional users who need advanced features, there are premium options. The Power BI Pro license, which is available for a monthly subscription fee, provides additional functionalities such as collaboration, extensive sharing capabilities, and integration with other Microsoft services like Azure and Office 365. For larger enterprises, the Power BI Premium offering includes dedicated cloud resources, the ability to create and distribute content without per-user licenses, and enhanced performance for large-scale datasets.
In conclusion, Microsoft Power BI stands out as a versatile and scalable tool that caters to a wide range of business intelligence needs. Its free version can serve as an excellent starting point for individuals and small teams, while the Pro and Premium versions unlock a more comprehensive suite of features designed to meet the demands of larger organizations. By leveraging Microsoft Power BI, businesses can harness the power of their data, leading to more informed decisions, optimized operations, and ultimately, a competitive edge in their respective markets.
#MSFTAdvocate #AbhishekDhoriya #LearnWithAbhishekDhoriya #DynamixAcademy
FAQs about Microsoft Power BI
What is Power BI used for?
Microsoft Power BI is a powerful business analytics tool designed to visualize data, share insights, and facilitate data-driven decision-making. It enables users to create interactive reports and dashboards, transforming raw data into actionable information. Organizations use Power BI to analyze performance metrics, track key performance indicators (KPIs), and gain deeper insights into their operations.
What is the full form of Power BI?
The full form of Power BI is “Power Business Intelligence.” It signifies the tool’s capability to empower users with robust business intelligence features that drive informed decision-making.
What is Power BI vs Excel?
While both Microsoft Power BI and Excel are data analysis tools, they serve different purposes. Excel is primarily a spreadsheet application used for data entry, complex calculations, and simple visualizations. Power BI, on the other hand, is focused on advanced data visualization, sharing, and collaboration. It offers features like real-time data access, interactive dashboards, and integration with various data sources, which are not as robust in Excel.
What is the full form of BI?
BI stands for “Business Intelligence.” It refers to technologies, applications, and practices used for the collection, integration, analysis, and presentation of business information. The goal is to support better business decision-making.
What is Power BI Desktop?
Power BI Desktop is a free application installed on a local computer, enabling users to connect to, transform, and visualize data. It provides a comprehensive environment for creating complex reports and dashboards, which can then be published to the Power BI service for sharing and collaboration.
How to learn Power BI step by step?
Learning Microsoft Power BI can be approached systematically through the following steps:1. Familiarize yourself with the Power BI interface and basic functionalities.2. Get hands-on practice by connecting to different data sources.3. Learn to transform and cleanse data using Power Query.4. Create and customize visualizations.5. Master the use of DAX (Data Analysis Expressions) for advanced calculations.6. Build and share reports and dashboards.7. Explore advanced features like Power BI service and mobile apps.Numerous online resources, tutorials, and courses are available to guide you through each step.
Can I learn Power BI by myself?
Yes, you can learn Microsoft Power BI by yourself. There are various self-paced learning resources available, including Microsoft’s own documentation, online courses, video tutorials, and community forums. Dedication and practice are key to becoming proficient in Power BI.
How long does it take to learn Power BI?
The time it takes to learn Power BI varies depending on your prior experience with data analysis tools and your dedication. On average, it may take a few weeks to a few months to become comfortable with the basics and intermediate features. Continuous practice and learning can help you master advanced functionalities over time.
Can we learn Power BI in 10 days?
While it is possible to grasp the basic concepts of Power BI within 10 days, becoming proficient typically requires more time and practice. A focused and intensive learning schedule can provide a good foundation, but ongoing practice and exploration of advanced features will be necessary to achieve expertise.

7 thoughts on “Unlocking the Power of Microsoft Power BI: A Comprehensive Guide 2024”