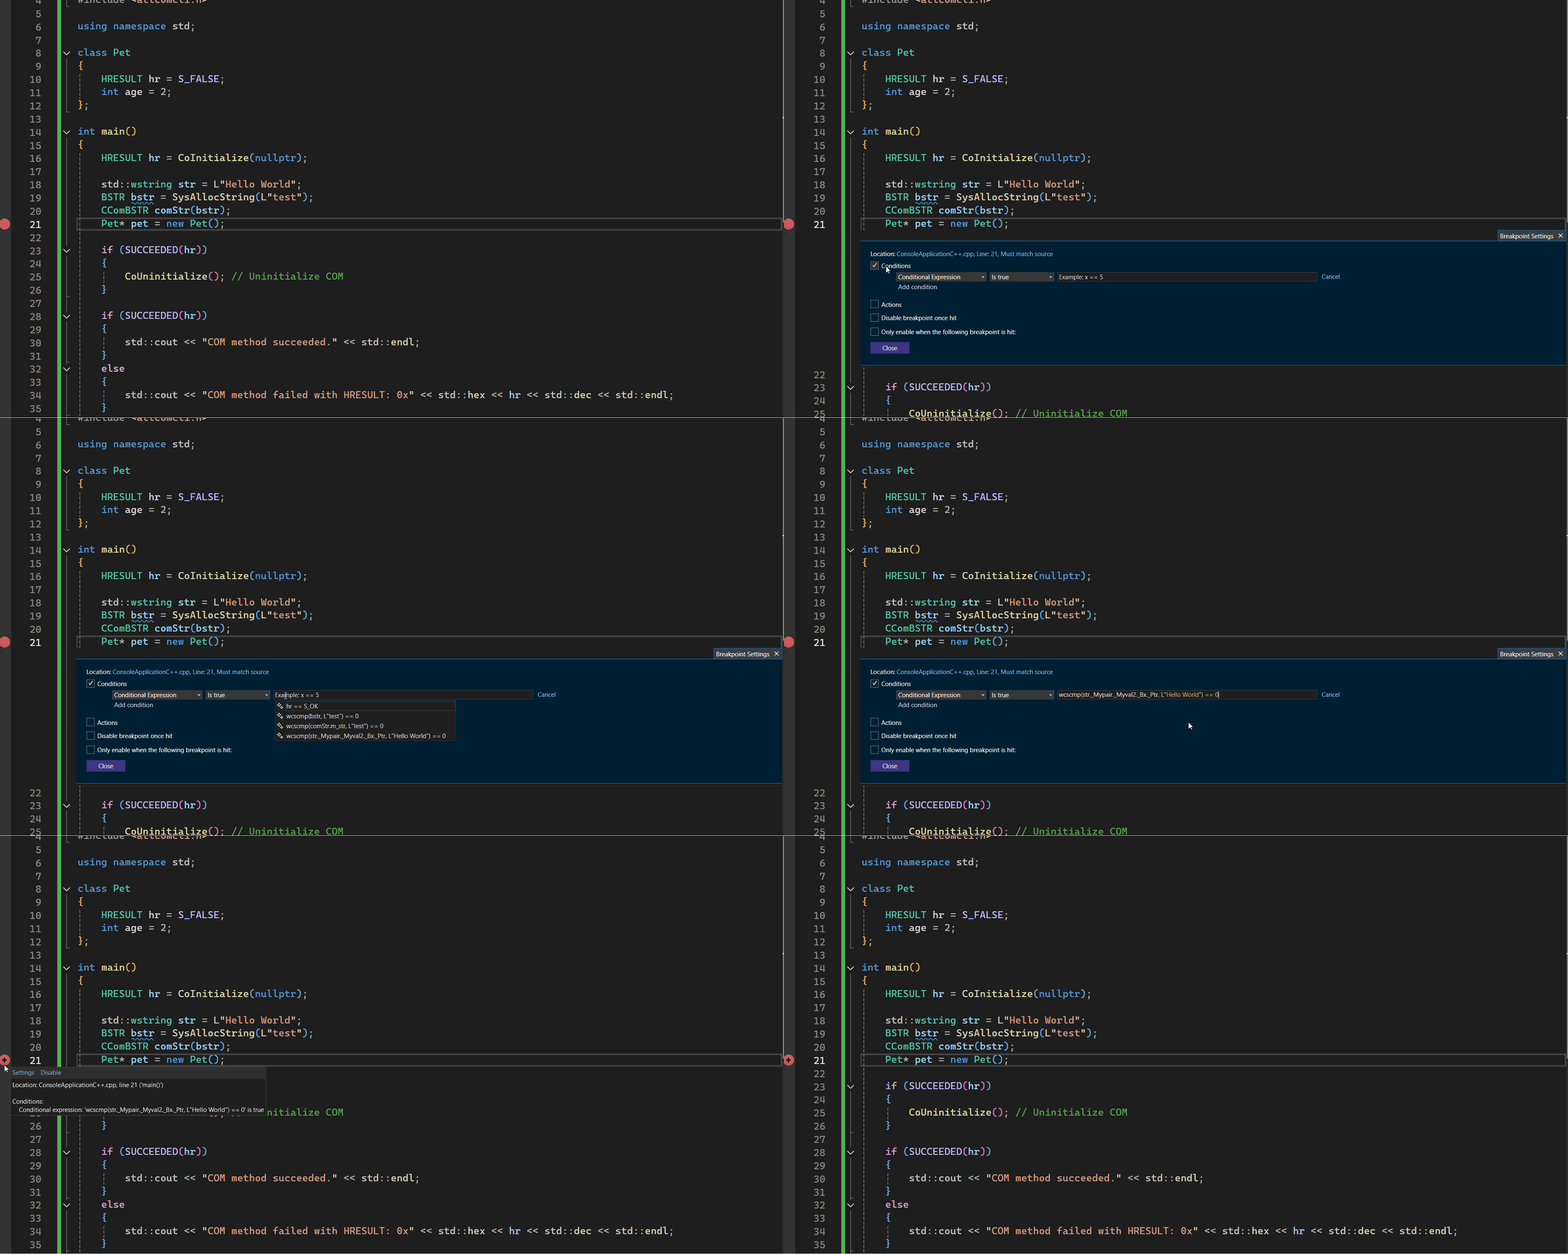
Explore AI-Generated Breakpoint Expressions with Visual Studio 2022 and GitHub Copilot
Understanding the labyrinthine art of debugging can be a daunting experience for many C++ developers. However, with the advent of AI-generated breakpoint expressions, your debugging journey just got a lot more intuitive. In this article, we’ll delve into AI-generated breakpoint expressions in C++ debugging, offering simple, easy-to-understand explanations for beginners on how to leverage these cutting-edge technologies.
Summary
Imagine having a virtual assistant that helps you pinpoint errors in your code more efficiently. That’s what AI-generated breakpoint expressions bring to the world of C++ debugging. Let’s discover how Visual Studio 2022 and GitHub Copilot can revolutionize your debugging process, making it faster and smarter!
What Are AI-Generated Breakpoint Expressions in C++ Debugging?
AI-generated breakpoint expressions are clever snippets of code suggested by an AI to help set breakpoints more effectively during debugging. When you’re looking for specific conditions to break your code execution, these AI-generated suggestions come in handy. By understanding the context of your code, the AI can suggest meaningful breakpoint conditions, saving you time and reducing errors.
C++ Debugging: The Traditional Way
Traditional C++ debugging often involves manually setting breakpoints, inspecting variable states, and identifying error locations one step at a time. While it’s a reliable technique, it can be tedious and time-consuming, especially in complex projects.

Enter Visual Studio 2022 and GitHub Copilot
Visual Studio 2022 and GitHub Copilot introduce an innovative leap in C++ debugging. GitHub Copilot, commonly known as an AI pair programmer, assists in writing code, recognizing patterns, and suggesting breakpoint expressions. This modern collaboration enhances Visual Studio’s already robust debugging tools, making them powerful allies in your development journey.
Conditional Breakpoints: An Asset for Precision
Conditional breakpoints are specialized breakpoints that halt code execution only when certain conditions are met. Here’s how they work:
- Set Conditions: Define specific scenarios where break execution should occur.
- Optimize Debugging: Focus on problematic cases and avoid sifting through irrelevant code runs.
- Improve Efficiency: Quickly diagnose issues with precise criteria.
Tracepoints: Beyond Simple Breakpoints
In C++ debugging, tracepoints are breakpoints that don’t halt code execution but log useful data for later analysis. They help you:
- Gather Runtime Data: Collect valuable information while the program runs.
- Diagnose Issues: Analyze logs to find patterns leading to errors.
- Performance Monitoring: Evaluate how certain code paths perform under different circumstances.
AI in Software Development
AI’s role in software development has expanded significantly. Leveraging machine learning algorithms, AI can now assist in debugging by:
- Pattern Recognition: Identifying common bug patterns and suggesting fixes.
- Runtime Analysis: Providing real-time insights into code performance.
- Efficiency Improvements: Reducing time spent on mundane tasks, allowing developers to focus on more critical aspects.
Code Efficiency Through AI-Generated Expressions
AI-generated expressions can significantly enhance your code efficiency. By offering suggestions for breakpoints and conditions, AI ensures that you’re always focusing on the right parts of your code.
Enabling AI-Generated Expressions in Visual Studio 2022
To get started with AI-generated expressions in Visual Studio 2022:
- Install Extensions: Ensure you have GitHub Copilot extension installed.
- Enable Features: Navigate through the settings to enable AI-generated suggestions.
- Start Debugging: Initiate a debugging session and start benefiting from AI insights.
GitHub Copilot: Your AI-Powered Pair Programmer
GitHub Copilot is an AI-powered tool designed to assist in coding tasks. During debugging, it can:
- Suggest Breakpoints: Offer smart suggestions for where to set breakpoints.
- Identify Issues: Automatically pinpoint potential errors and provide correction ideas.
- Improve Productivity: Speed up debugging by reducing the manual effort.
How to Use GitHub Copilot for Conditional Breakpoints?
Setting up conditional breakpoints using GitHub Copilot is straightforward:
- Initiate Debugging: Open your C++ project in Visual Studio 2022.
- Invoke Copilot: Use Copilot’s suggestions to set conditional breakpoints.
- Refine Conditions: Modify the suggested conditions as per your debugging needs.
Setting Up AI-Generated Tracepoints in Visual Studio
Here’s how you can leverage AI-generated tracepoints:
- Enable Copilot: Ensure GitHub Copilot is active in your environment.
- Add Tracepoints: Use AI suggestions to create tracepoints within your code.
- Analyze Results: Collect and analyze run-time data to identify performance bottlenecks or issues.
Can AI-Generated Expressions Replace Traditional Debugging?
While AI-generated expressions significantly enhance the debugging process, they aren’t a complete replacement for traditional methods. They serve as a powerful complement, providing suggestions and insights that can streamline workflow and improve accuracy.
The Limitations of Using AI for Debugging
Despite its many benefits, AI has some limitations in debugging:
- Contextual Errors: AI might misinterpret code context, leading to incorrect suggestions.
- Over-reliance: Developers might become overly dependent on AI, potentially hampering their problem-solving skills.
- Incomplete Solutions: AI-generated suggestions may sometimes require manual refinement.
Conclusion
AI-generated breakpoint expressions in C++ debugging represent a transformative step in software development. By incorporating AI tools like Visual Studio 2022 and GitHub Copilot, developers can now debug more efficiently, saving time and enhancing the accuracy of their work. Embrace these technologies to supercharge your debugging process, streamline workflows, and elevate your coding proficiency.
Frequently Asked Questions (FAQs)
Q. What are AI-generated breakpoint expressions in C++?
A: AI-generated breakpoint expressions are AI-driven suggestions to help set effective breakpoints during C++ debugging.
Q: How do conditional breakpoints work?
A: Conditional breakpoints halt code execution only when specific conditions are met, focusing on relevant debugging scenarios.
Q: What are tracepoints in C++ debugging?
A: Tracepoints are like breakpoints but they log data without pausing execution, helping diagnose issues and collecting runtime data.
Q: How can AI help in debugging C++ code?
A: AI can suggest breakpoints, identify issues, provide real-time insights, and reduce time spent on routine debugging tasks.
Q: How to enable AI-generated expressions in Visual Studio 2022?
A: Install and enable the GitHub Copilot extension in Visual Studio 2022 to start receiving AI-generated breakpoint suggestions.
Q: What are the benefits of using GitHub Copilot for debugging?
A: GitHub Copilot improves debugging speed, offers intelligent suggestions, and aids in identifying and fixing errors efficiently.
Q: How to use GitHub Copilot for conditional breakpoints?
A: GitHub Copilot can suggest conditional breakpoints which can be refined and used to focus on specific debugging conditions.
Q: How to set up AI-generated tracepoints in Visual Studio?
A: Enable GitHub Copilot and use its suggestions to set up tracepoints, logging runtime data for analysis.
Q: Can AI-generated expressions replace traditional debugging methods?
A: No, but they complement traditional methods by making the process faster and offering insights that might be overlooked manually.
Q: What are the limitations of using AI for debugging?
A: AI-generated suggestions might sometimes be incorrect, and over-reliance on AI can impede a developer’s problem-solving skills.
Explore how AI-generated breakpoint expressions in C++ debugging can revolutionize your development process. Learn about Visual Studio 2022, GitHub Copilot, conditional breakpoints, tracepoints, and more in this beginner-friendly guide.
#MSFTAdvocate #AbhishekDhoriya #LearnWithAbhishekDhoriya #DynamixAcademy
References & Read More:
- Understanding Microsoft Power Platform ROI for Beginners
- Fetching the First Row from a Dataverse Table in Power Automate Simplified
- Demystifying GitHub Copilot in Visual Studio
- How to Overcome SharePoint List View Threshold Errors?
- Unveiling EY Dynamics 365 Sales: A Comprehensive Guide for Beginners
- Demystifying SharePoint Document Location URL Invalid Characters

1 thought on “Mastering C++ Debugging: Exploring AI-Generated Breakpoint Expressions with Visual Studio 2022 and GitHub Copilot”