What is Persistent Target Selection in Visual Studio 2022?
Visual Studio 2022 is packed with features aimed at improving a developer’s productivity and code performance. One of its standout additions is the Persistent Target Selection feature, designed to streamline the profiling process. This beginner-friendly guide will walk you through the concept and importance of Persistent Target Selection, along with an overview of other powerful profiling tools available in Visual Studio 2022.
Introduction to Visual Studio 2022
Visual Studio 2022 is Microsoft’s latest iteration of their popular Integrated Development Environment (IDE). It is designed to cater to various programming needs, with a focus on streamlined workflows, sophisticated code editing and debugging capabilities, and advanced profiling tools to boost your code’s efficiency.
What is Persistent Target Selection?
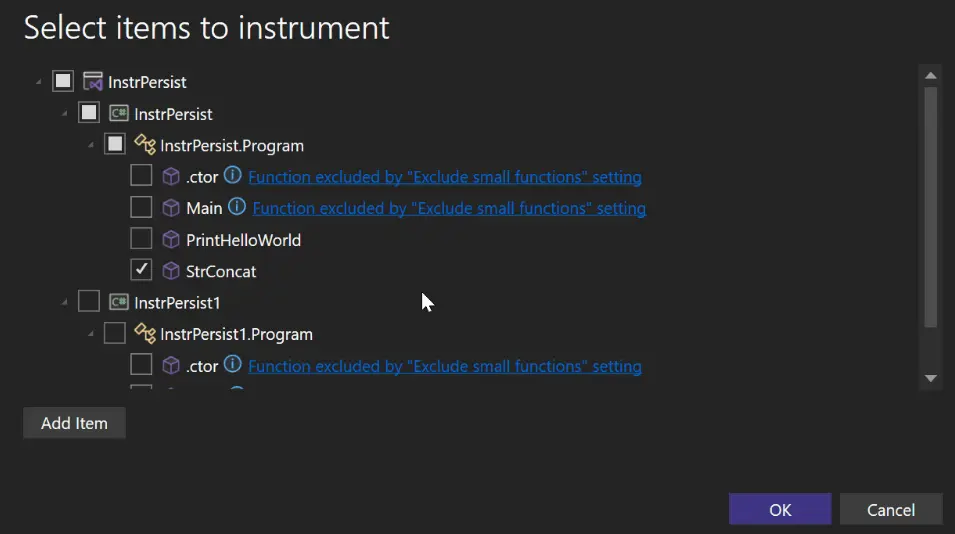
Persistent Target Selection is a new feature in Visual Studio 2022 that allows developers to maintain a specific process as the profiling target, even between debugging sessions. This improvement simplifies the workflow by reducing the need to repeatedly select the target process for profiling, saving valuable development time.

Instrumentation Profiling in Visual Studio 2022
Instrumentation Profiling is an essential tool in Visual Studio 2022 that helps you understand the performance aspects of your code. It works by injecting probes or instrumentation directly into your code, enabling you to trace method calls, and gather detailed performance data. This profiling method is particularly useful for identifying performance bottlenecks and optimizing code execution paths.
Performance Profiling in Visual Studio 2022
Performance Profiling is another powerful capability of Visual Studio 2022, which helps developers pinpoint performance issues within their applications. By analyzing CPU usage, memory consumption, and other critical metrics, you’ll gain valuable insights that can lead to substantial performance improvements in your code.
Code Performance Assessment
Assessing your code’s performance is crucial to delivering efficient and responsive applications. Visual Studio 2022 provides various tools and metrics to help you identify areas that require optimization. Key techniques include:
- Profiling: Using profiling tools to gather performance data.
- Benchmarking: Comparing the performance of different code segments.
- Optimization: Making targeted improvements based on the performance data collected.
New Features in Visual Studio 2022
Visual Studio 2022 introduces a plethora of new features designed to enhance developer productivity and code quality:
- 64-bit IDE: Allows for smoother handling of large solutions.
- Enhanced Debugging: Improved breakpoints, data visualizations, and snapshot debugging.
- IntelliCode: AI-assisted code suggestions to boost coding efficiency.
- Live Preview: Real-time feedback on code changes.
Optimization Techniques using Visual Studio Profiling Tools
Visual Studio offers several profiling tools to help you optimize your code:
- CPU Usage Profiler: Identify methods that consume excessive CPU resources.
- Memory Usage Profiler: Pinpoint memory leaks and high memory-consuming areas.
- Concurrency Visualizer: Analyze multi-threaded applications for synchronization issues.
| Tool | Purpose |
|---|---|
| CPU Usage Profiler | Identifies CPU-intensive methods and bottlenecks |
| Memory Usage Profiler | Detects memory leaks and high memory usage |
| Concurrency Visualizer | Analyzes multi-threaded application performance |
How to Use Persistent Target Selection?
Using Persistent Target Selection in Visual Studio 2022 is straightforward. Follow these steps:
- Start Visual Studio 2022: Open your solution.
- Select Target Process: During the first profiling session, choose the process you want to profile.
- Enable Persistent Target Selection: Configure Visual Studio to remember your selection for future sessions.
This process eliminates the redundant step of re-selecting your profiling target each time, making your profiling tasks more efficient.
Conclusion
Persistent Target Selection in Visual Studio 2022 is a game-changer for developers looking to streamline their profiling workflow. Coupled with various powerful profiling tools, Visual Studio 2022 empowers you to optimize code performance with ease. By leveraging these features, you can enhance your development process and deliver high-performance applications.
FAQs
How do I use persistent target selection in Visual Studio 2022?
Persistent Target Selection allows you to choose a process to profile and have Visual Studio remember it for subsequent sessions. To use it, select your target process during the first profiling session and enable the setting for Visual Studio to remember your choice.
What is instrumentation profiling in Visual Studio?
Instrumentation Profiling in Visual Studio involves inserting probes into your code to gather detailed performance data. This method helps you trace method calls, identify bottlenecks, and optimize code execution.
How can I improve my code performance using Visual Studio?
To improve code performance in Visual Studio, use the profiling tools to gather data on CPU and memory usage, analyze multi-threaded performance, and identify bottlenecks. Based on this data, make targeted optimizations to your code.
What are the benefits of persistent target selection in Visual Studio?
The main benefits of Persistent Target Selection include saving time by not having to re-select your profiling target for each session and streamlined workflows, making the profiling process more efficient.
How to enable Performance Profiler in Visual Studio?
To enable Performance Profiler in Visual Studio, go to Debug > Performance Profiler, and select the profiling tools you wish to use (CPU Usage, Memory Usage, etc.). Start your profiling session by clicking Start.
Can I change the target process during profiling in Visual Studio?
Yes, you can change the target process during profiling sessions in Visual Studio, although it may disrupt your workflow. Persistent Target Selection helps maintain a consistent target across sessions.
Does Visual Studio 2022 remember the profiling target between runs?
Yes, with the Persistent Target Selection feature, Visual Studio 2022 remembers the profiling target that you previously selected, making it easier to continue profiling without re-selecting the target process.
#MSFTAdvocate #AbhishekDhoriya #LearnWithAbhishekDhoriya #DynamixAcademy
References & Read More:
- A Comprehensive Guide to Microsoft Dynamics 365 ERP Security
- Predictive Maintenance in Field Service: Understanding AI’s Transformative Role Today
- Harnessing the Power of Generative AI in Customer Relationship Management for Sales Growth
- Creating a React TODO App in Visual Studio 2022: A Complete Beginner’s Guide
- Unlocking the Power of Microsoft Copilot Studio: A Comprehensive Guide for Beginners 2024

2 thoughts on “A Comprehensive Guide to Persistent Target Selection in Visual Studio 2022: A Beginner’s Approach”